


2024 has been about markets trying to gauge how the world will look post the big rate hikes of 2022-23. In April, it was “higher for longer”. Growth held up, inflation was resilient and central banks sounded cautious. In August, the US labour market wobbled, and markets demanded cuts. Equities sold off and rates rallied.
Both the bullish and the bearish view of the economy have their own merits. What seems misplaced is for investors to expect to get the best of both worlds. In September, risk markets rallied, but rates markets failed to sell off. The story goes that the Fed moved to a precautionary stance. Asset prices point to a solid economy and deep cuts at the same time.
For 2025, consensus expects 10% US earnings growth, the lowest credit stress in history, and another 200bp of Fed cuts1. We fear it will not be that easy.
Surely, central banks’ reaction function has changed. As some pressure came off the US residential sector, Powell claimed victory on inflation. US core PCE has averaged 2% in the past four months and pressures have receded across sectors. What keeps central bankers awake at night is growth, with the slow reaction to inflation in 2021 still fresh in memory. The 50bp cut in September tells us the Fed won’t make the same mistake again.
The Fed pledge was so strong that the bar for dovish surprises is as high as ever. The September dot plot shows central bank is on autopilot, and markets price one cut per meeting to the end of 2025. Long rates is a strong consensus view and inflows into bonds have been the highest since 2020. Global curves are disinverting (Chart 1). Historically, the first Fed cut has often matched with the time to reduce duration (Chart 2).
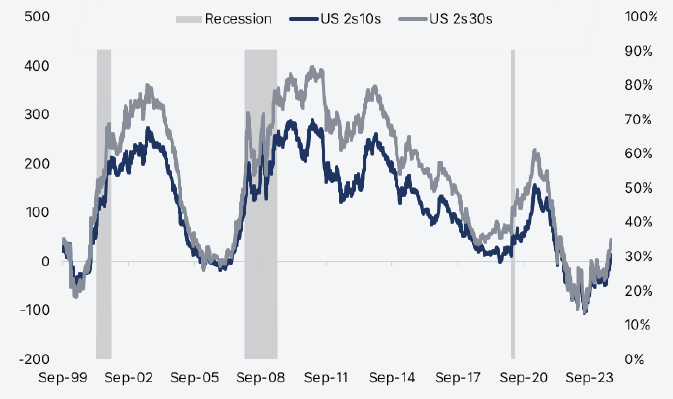
Note: US 2s10s (USYC2Y10 Index), US 2s30s (USYC2Y30 Index).
Source: Algebris Investments, Bloomberg Finance L.P. Data as of 20.09.2024.
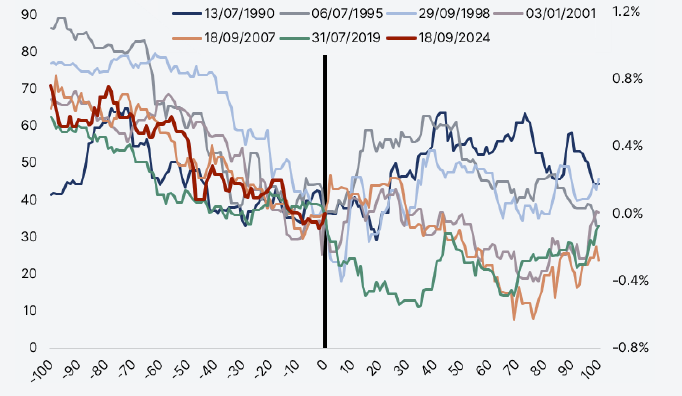
Note: US Treasury 10-year yields absolute differences with respect to yield at first cut date. Source: Algebris Investments, Bloomberg Finance L.P. Data as of 20.09.2024.
US elections are the next story and one that doesn’t bode well for duration. Both candidates are banking on heavy fiscal platforms. The fiscal cost of any candidate platform can easily get to 2% of GDP over the next four years, with a fiscal picture which is the weakest since WWII (Chart 3). Markets have priced out a Trump victory (Chart 4). In 2016, a Republican sweep meant sharp moves in fixed income, a steeper curve and a stronger USD (Chart 5).
The US economy is slowing but not tanking. The Atlanta Fed tracker points to US growth at 3%. In Europe, things are worsening more quickly. ECB growth targets are too ambitious so European rates have more downside. Chinese authorities have realized 5% growth target is too high and ramping up stimulus. Our model sees chances of a near-term US recession on the rise but below 50% (Chart 6).
Slowing macro and risk assets at highs make markets fragile. There is limited upside, and it will not take much to turn investors who are nervously long into sellers. Market fragility is amplified by recession being fully priced in rates markets: duration won’t be a hedge in the next selloff. We continue to see opportunities, especially in credit. All-in yields and dispersion are both high. We believe it is time to reduce market and duration beta and focus on active alpha-generation in our strategies.
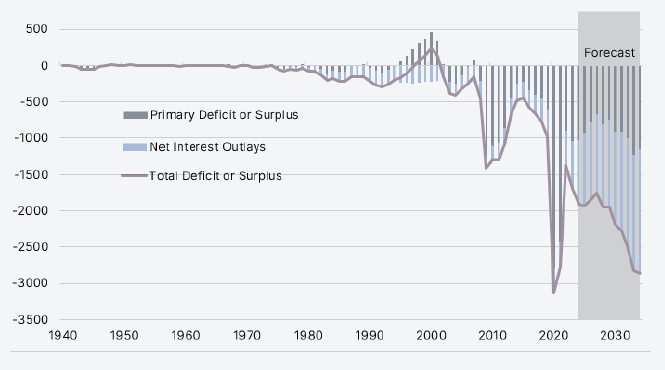
US Total Deficit or Surplus ($bn). Source: Algebris Investments, Congressional Budget Office. Data as of 30 June 2024. There is no guarantee that projections will materialize.
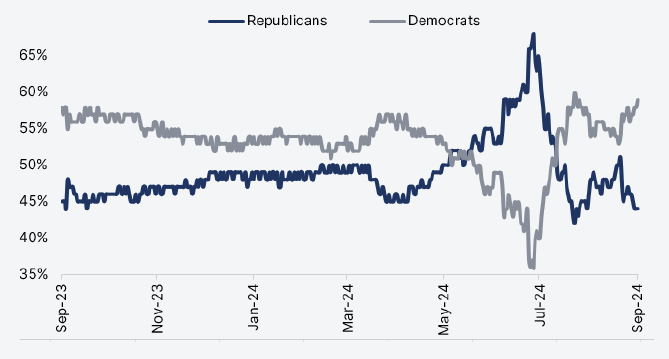
Note: Probabilities based on betting markets.
Source: Algebris Investments, PredictIt. Data as of 20.09.2024.
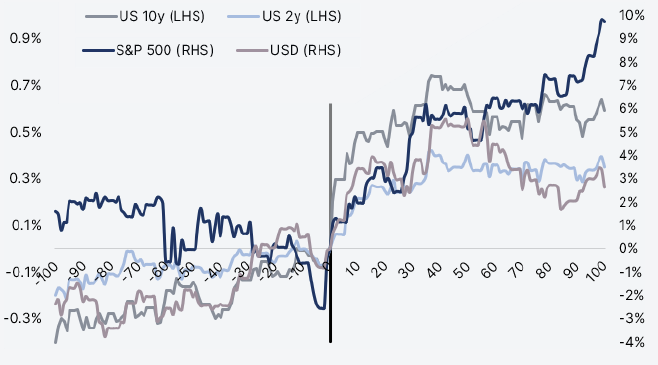
Note: US 10y (GT10 Govt) and US 2y (GT2 Govt) lines show the absolute yield difference with respect to the yield prevailing on the election day. Election day is represented with the vertical black line; the horizontal axis represents 100 days before and after. S&P 500 (SPX Index) and USD (DXY Index) lines show the relative index level with respect to the index level prevailing on the election day. Election day was 08/11/2016. Source: Algebris Investments, Bloomberg Finance L.P. Data as of 20.09.2024.
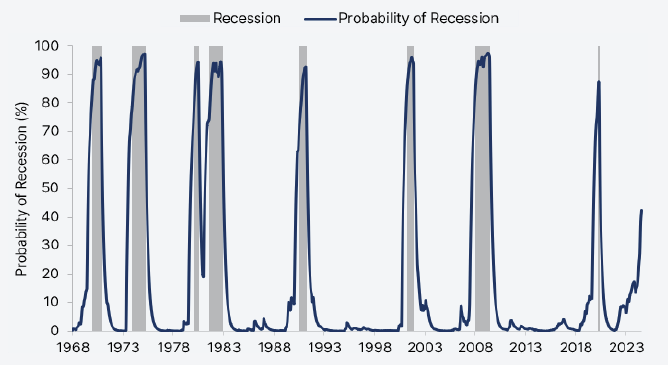
Note: Calculations based on a Machine Learning (ML) model that uses “hard” economic variables such as Industrial Production, Non-Farm Payrolls, etc. Source: BLS, BEA, Fed, Algebris Investments calculations, as of 8 Aug 2024. There is no guarantee that projections will materialize.
Credit | Mind the beta
Credit beta has been the 2024 trade, but it has now run its course. Credit spreads are back to early 2022 levels and did not widen during August volatility. Historically, such spreads have been signalling one-year returns of 0-3% in credit markets (Chart 7). All-in yield may add some extra reward this time, but we see the upside in indexes as capped. Implied default rates are at lows despite a small uptick in distressed exchanges which started in 1H24.
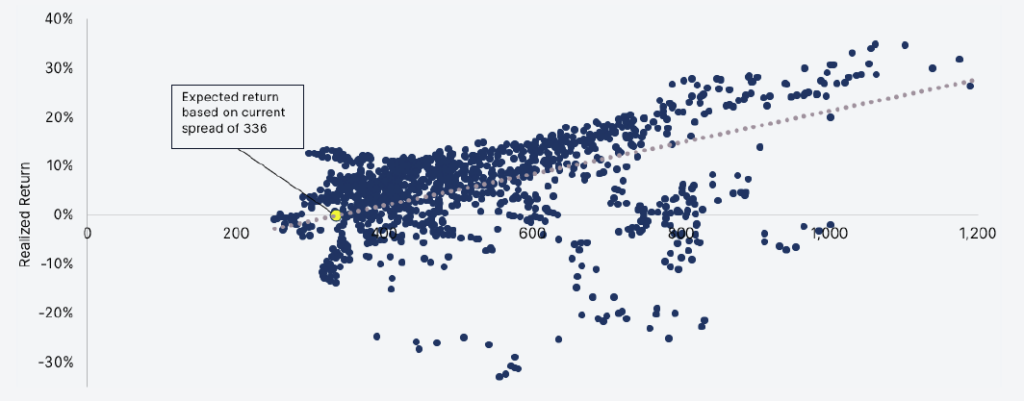
US High Yield (H0A0 Index) index performance over 12 months at given index spread level (data from Jan 1st 2000, weekly spreads and returns vs 12 months ahead). Blue dots represent realized performance. Yellow dot is the forecasted performance based on current index spread. Source: Algebris Investments, Bloomberg Finance L.P., data as of 20.09.2024.
Credit | Dispersion means opportunity
The good news is that dispersion is high for the overall level of spreads (Chart 8). The average spread is tight, but credit indexes include 5-20% of bonds that trade wider than their 70th historical percentile. There is value in credit picking. We see value in telecommmunications and selected utilities with 350-400bp spread and a solid pool of assets backing debt. Junior debt of European real estate offers spreads north of 500bp and benefits from falling rates. Financials require a more selective approach compared to one year ago, but some issues offer 500-600bp from names with solid capital buffers and asset quality. In emerging markets, high yield sovereigns offer 600-700bp spreads despite historically low liquidity needs and local markets offer real yields at historical highs despite a dovish Fed.
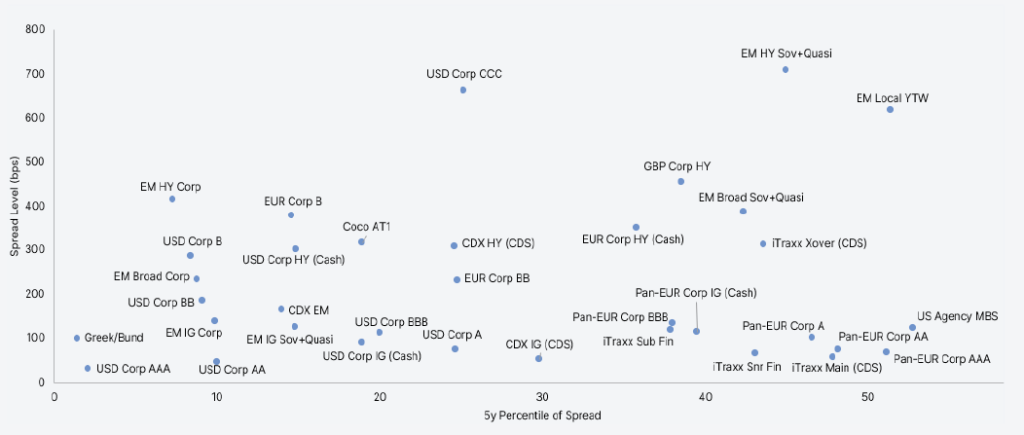
Note: Credit Spread Level vs 5y Percentile of Credit Spread. Source: Algebris Investments, Bloomberg Finance L.P. data as of 06.09.2024.
Fiscal | The elephant in the room
US fiscal policy remains the main latent risk. Post-2021, governments have taken over the role of lender of last resorts from central banks and policy has become acyclical. In 2023, the US deficit has been 7% despite growth north of 3% and unemployment below 4%. The interest burden will continue to increase over the next three years no matter how deeply the Fed cuts. The US Congressional Budget Office projects the US debt-to-GDP ratio to increase by 30% by 2030. Supply estimates have been revised up for the past several quarters and take-up at UST auctions has become mixed. A US bond vigilantes’ moment is the key market risk for 2025.
Central banks | Recalibration
Global inflation is back under control (Chart 9). This has been the big change summer has brought, shifting the attention of central bankers to growth. Current inflation leaves global real rates too high, justifying a recalibration. The urgency felt by markets is misplaced, at least in the US. Labour market data are deteriorating but not slumping. The US job market is on track for 100k payrolls per month with unemployment at 4.2%. This level is historically not consistent with a recession. In Europe, PMIs are falling quickly, and confidence is low. Leading indicators point to 0.5% forward growth, vs 1.3% projected by ECB for 2025. China has slowed to track 4% from 5% earlier this year, but authorities are ramping up stimulus. In the US, market is pricing one cut per meeting and a 2.75% policy rate by late 2025. In Europe, rates are expected to be closer to 2%. We see upside in the former and downside in the latter.
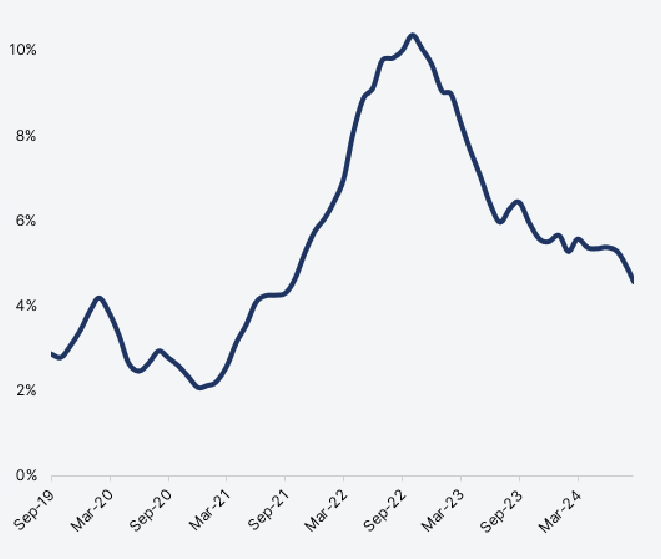
Note: IMF World Inflation CPI (WOININFL Index). Source: Algebris Investments, Bloomberg Finance L.P. Data as of 20.09.2024.
FX | USD Conundrum
The main feature of FX markets in 2024 has been USD weakness. As US macro slowed the most in G10, the Fed is now perceived as the most dovish central bank globally. Near term, risks on USD are on the upside. Too many cuts are priced on the US curve and US elections may bring tariff discussions yet again. Longer term, however, USD debasement may be the only way to make US debt sustainable. This is especially true if Asian currencies are able to gain attractiveness, as the Japanese Yen performance in August demonstrated.
Davide Serra
Founder & CEO
Sebastiano Pirro
CIO & Financial Credit Portfolio Manager
Gabriele Foà
Global Credit Portfolio Manager
Silvia Merler
Head of ESG & Policy Research
For more information about Algebris and its products, or to be added to our distribution lists, please contact Investor Relations at algebrisIR@algebris.com. Visit Algebris Insights for past commentaries.
This document is issued by Algebris Investments. The information contained herein may not be reproduced, distributed or published by any recipient for any purpose without the prior written consent of Algebris Investments.
The information and opinions contained in this document are for background purposes only, do not purport to be full or complete and do not constitute investment advice. This document does not constitute or form part of any offer to issue or sell, or any solicitation of an offer to subscribe or purchase, any investment nor shall it or the fact of its distribution form the basis of, or be relied on in connection with, any contract therefore.
No reliance may be placed for any purpose on the information and opinions contained in this document or their accuracy or completeness. No representation, warranty or undertaking, express or implied, is given as to the accuracy or completeness of the information or opinions contained in this document by any of Algebris Investments, its members, employees or affiliates and no liability is accepted by such persons for the accuracy or completeness of any such information or opinions.
The distribution of this document may be restricted in certain jurisdictions. The above information is for general guidance only, and it is the responsibility of any person or persons in possession of this document to inform themselves of, and to observe, all applicable laws and regulations of any relevant jurisdiction. This document is suitable for professional investors only. Algebris Group comprises Algebris (UK) Limited, Algebris Investments (Ireland) Limited, Algebris Investments (US) Inc. Algebris Investments (Asia) Limited, Algebris Investments K.K. and other non-regulated companies such as special purposes vehicles, general partner entities and holding companies.
© Algebris Investments. Algebris Investments is the trading name for the Algebris Group.
